Analyze your ad creatives from a single screen!
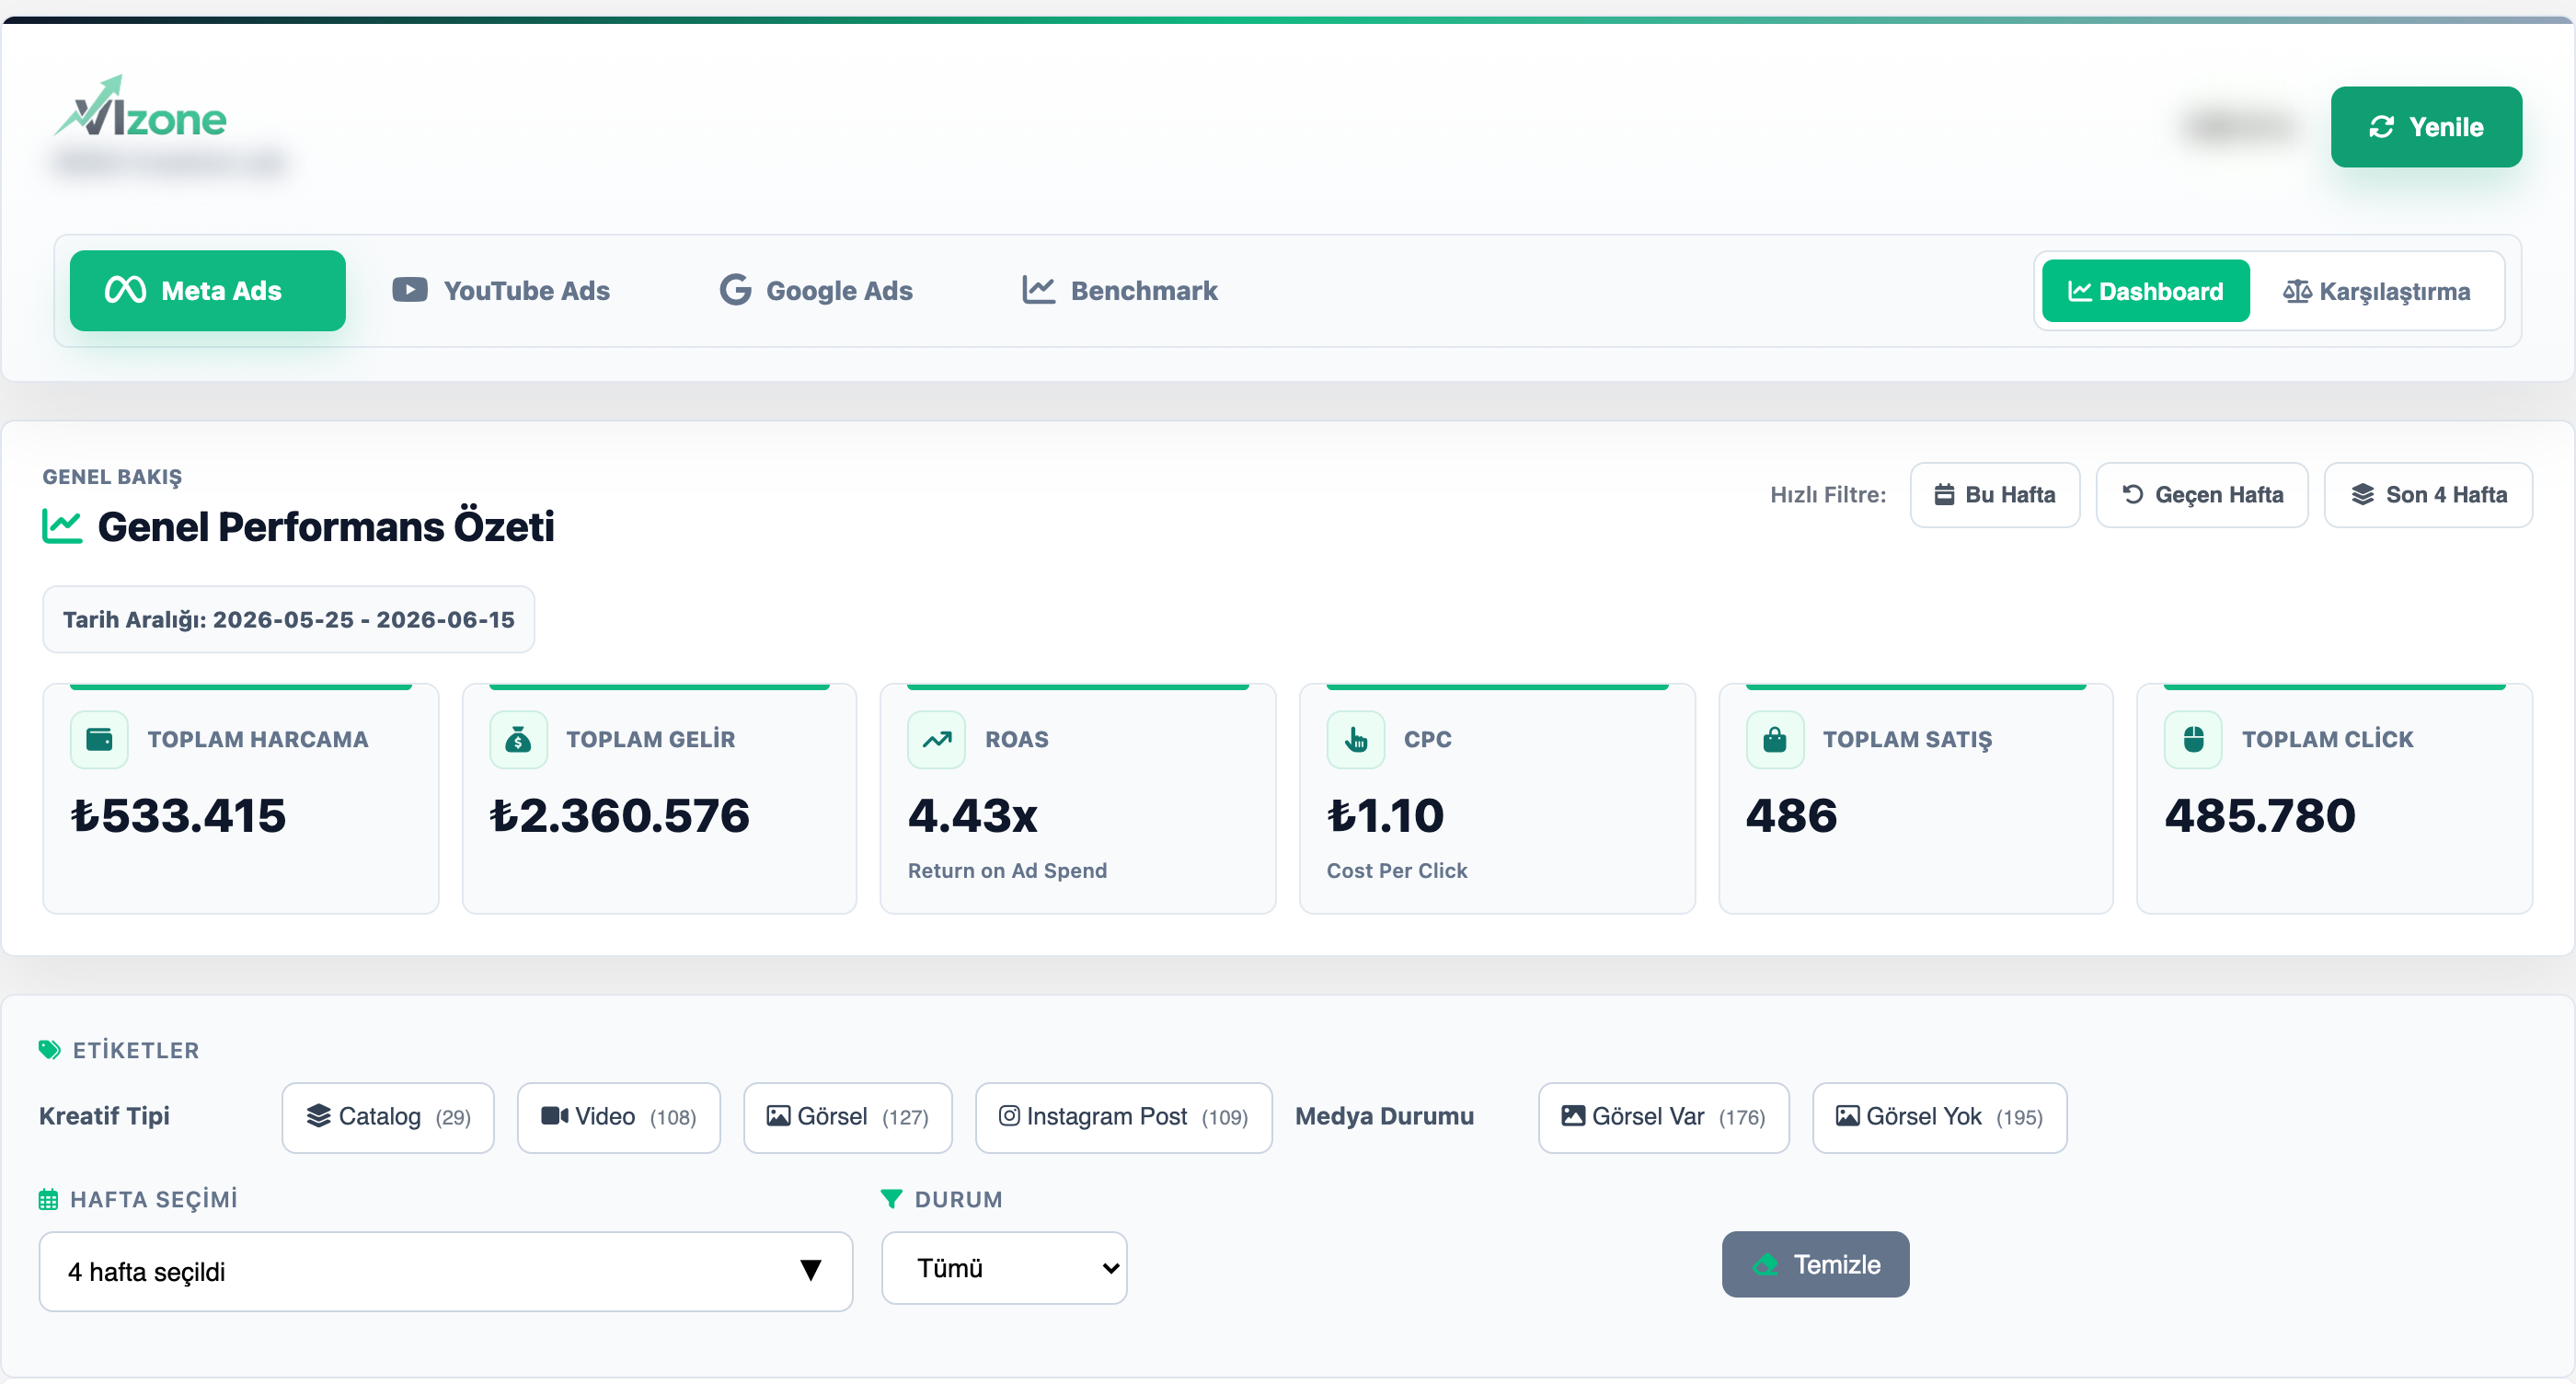
VIzone Creative Lab is a creative intelligence panel Clickzone offers only to its customers. It brings your Meta, Google Ads and YouTube ad creatives together on one screen; it shows which visual and concept convert, the performance of your RSA copy and YouTube videos, and your competitor benchmark. Our team runs all the analysis on your brand's behalf.
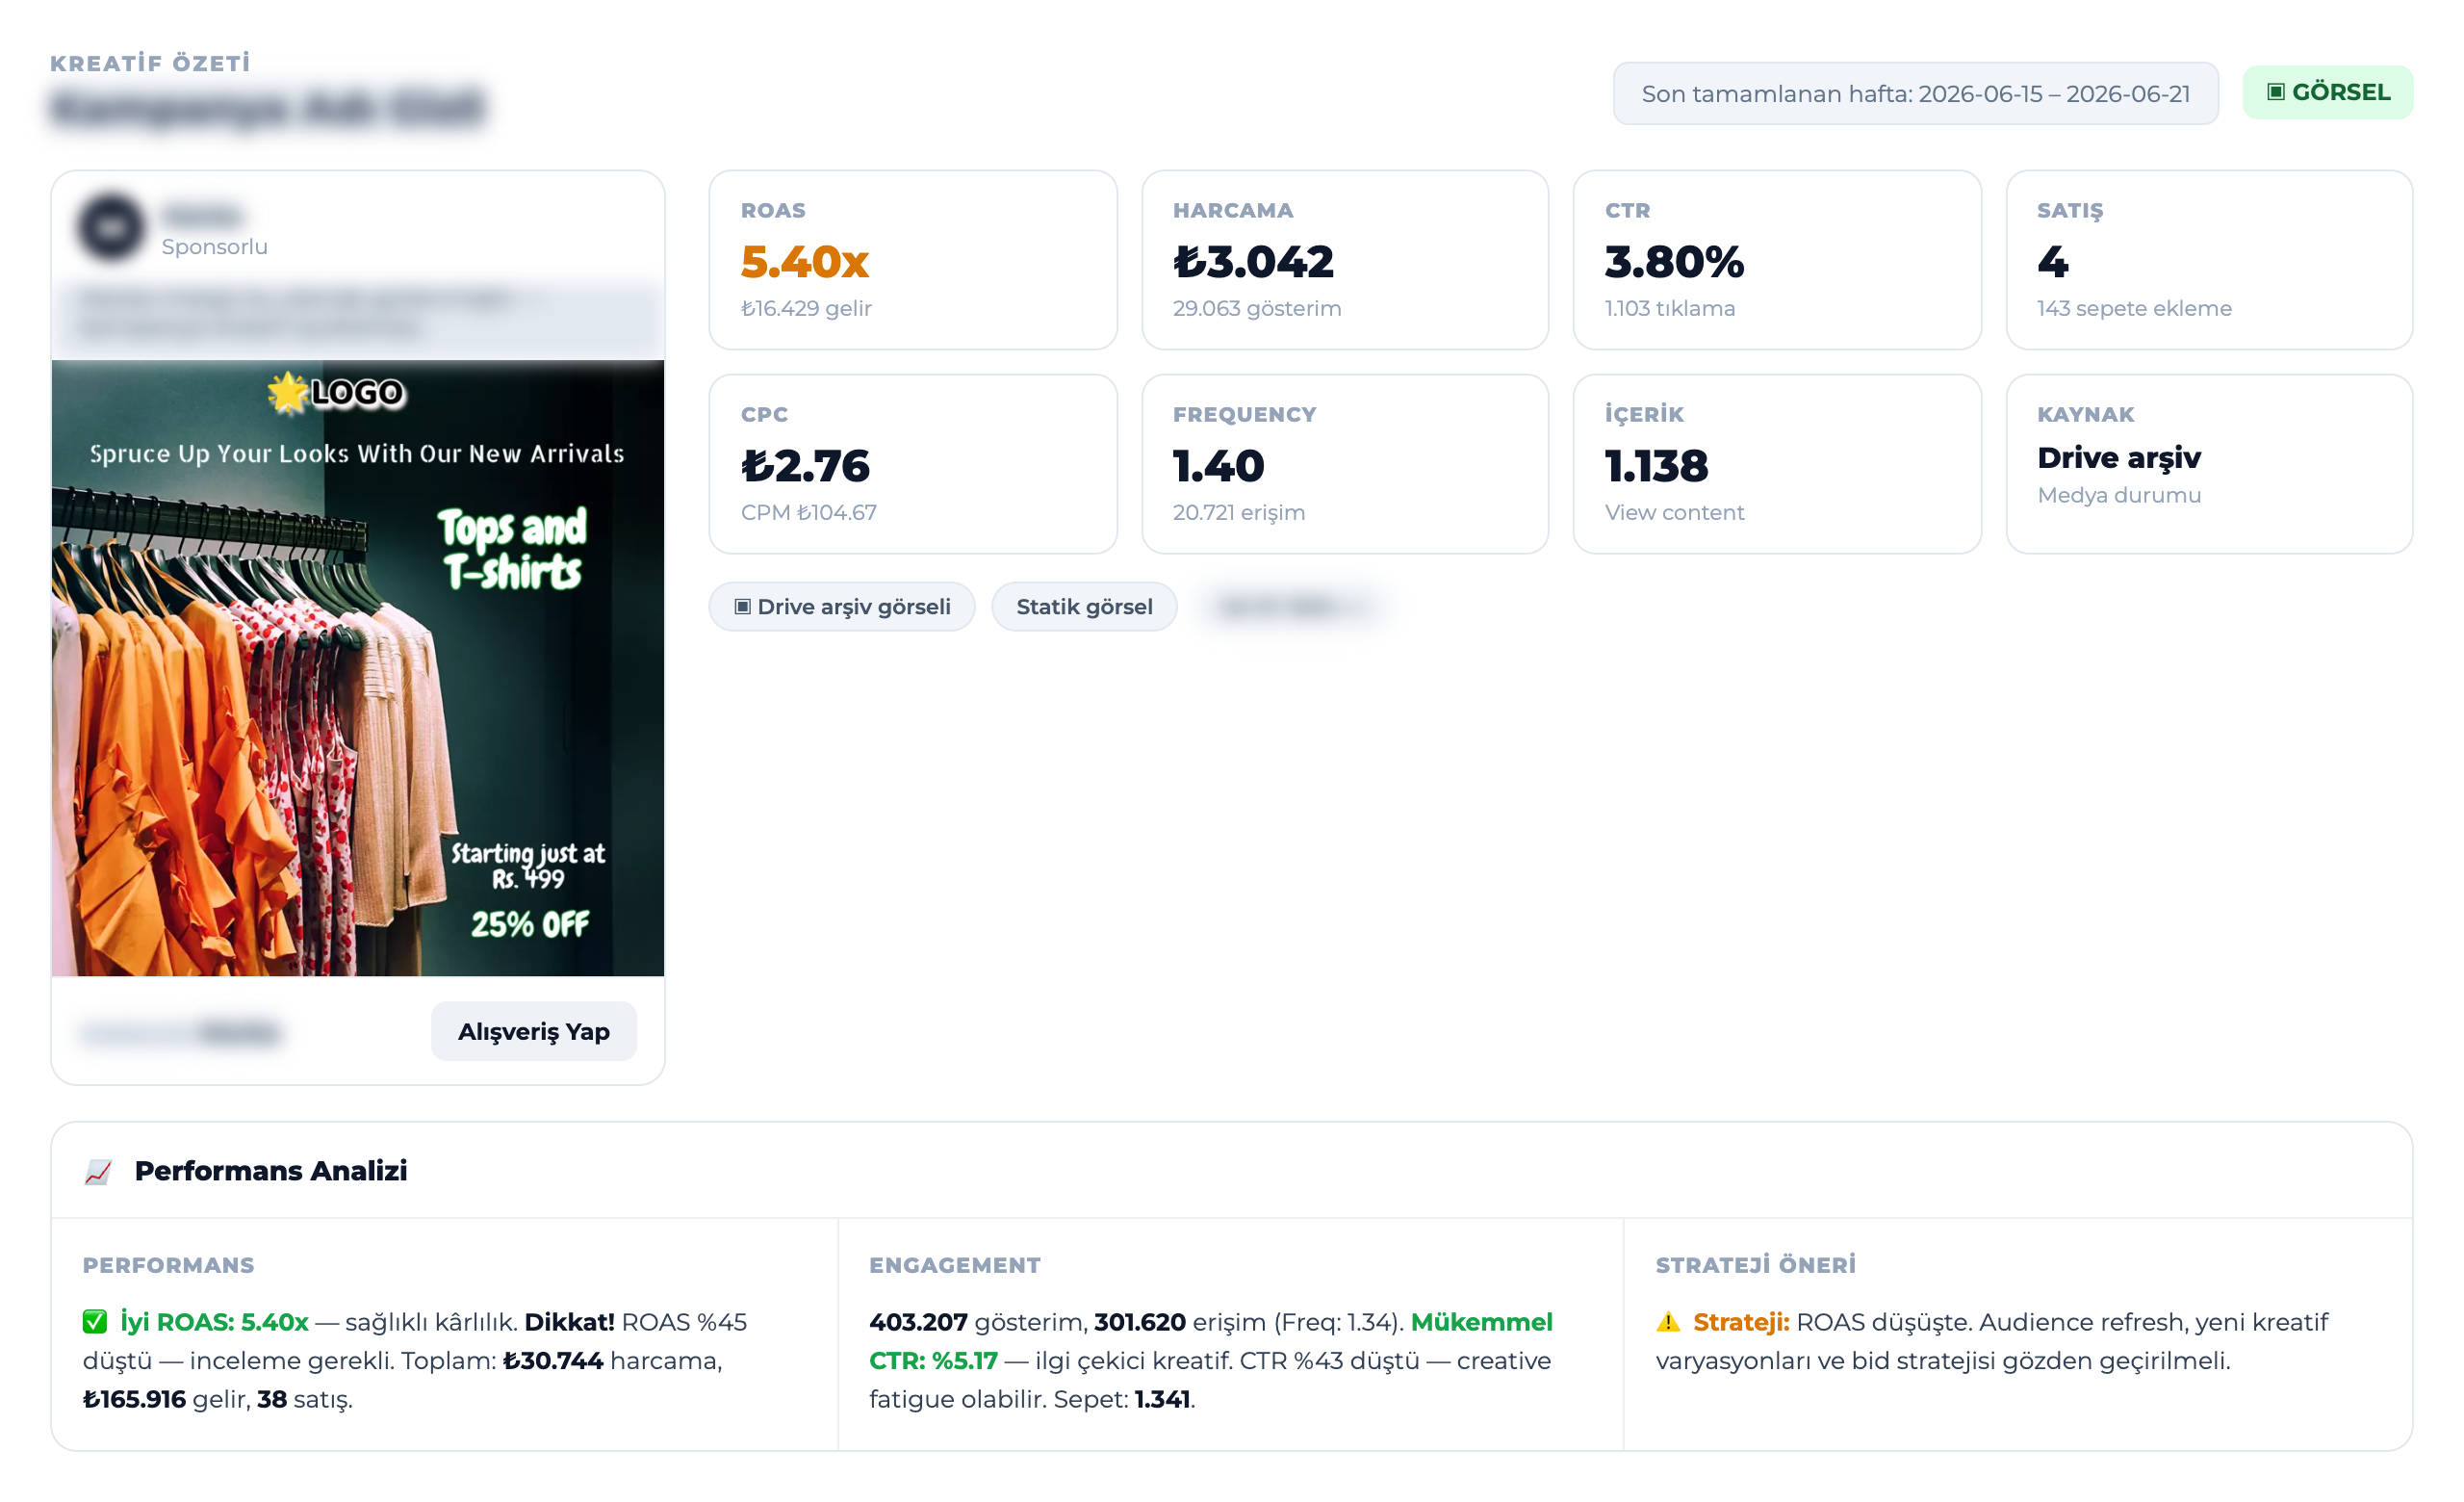
In-depth analysis of every creative
A single creative's performance, engagement and strategy recommendation; broken down by week and signal on one screen.
Your creatives' real performance in one panel
VIzone Creative Lab is a creative intelligence panel Clickzone offers exclusively to its customers. It brings your brand's Meta, Google Ads and YouTube ad creatives into one panel: comparative visual analysis on the Meta side, RSA copy performance on the Google Ads side, video performance on the YouTube side; plus competitor benchmark and quality / engagement / conversion ranking signals. It reveals which concept and format convert and gives concrete recommendations for your next creative strategy. The panel is set up by Clickzone specifically for your brand and run by our team.
- Creative Intelligence
- Making sense of ad creative performance with data and steering it.
- RSA
- Responsive Search Ads — Google Ads' text ads with headline/description combinations.
- Benchmark
- Comparing your performance against industry and competitor approaches.
Take creative decisions out of guesswork
With each channel's own creative signal; see with data which visual, copy and video win.
On your brand's behalf, in four steps
From analysis to action
It doesn't just report; it clarifies your next creative decision.
Visual · Copy · Video
Meta visual comparison, Google Ads RSA copy and YouTube video performance in one panel.
Benchmark & Ranking
Competitor comparison and Meta quality / engagement / conversion signals.
Strategy & Recommendation
Concept-based winner/loser analysis and a concrete recommendation for the next creative.
Track every metric week by week
Track each creative not as a one-off score but week by week with the Performance, Engagement, Video and Rankings tabs. See how clicks, CTR, CPC, sales, spend, revenue and ROAS move over the period and catch creative fatigue and trends early.
| Metric | 2026-05-25 | 2026-06-01 | 2026-06-08 | 2026-06-15 | Total |
|---|---|---|---|---|---|
| Clicks | 892 | 155 | 179 | 8 | 1.234 |
| CTR (%) | 0.08% | 0.08% | 0.06% | 0.03% | 6.09% |
| CPC (₺) | ₺1.09 | ₺0.87 | ₺1.12 | ₺2.19 | ₺1.07 |
| Sales | 1 | 0 | 0 | 0 | 1 |
| Spend (₺) | ₺971 | ₺136 | ₺201 | ₺18 | ₺1.325 |
| Revenue (₺) | ₺3.423 | ₺0 | ₺0 | ₺0 | ₺3.423 |
| ROAS | 3.53x | 0.00x | 0.00x | 0.00x | 2.58x |
Common questions
Find the winning creative with data
Let us set up VIzone Creative Lab for your brand; let's see your Meta, Google Ads and YouTube creative performance, your competitor benchmark and your next strategy in one panel.