
Data Analytics
Turn Data IntoActionable Insights
Make decisions measurable with reporting, dashboards and visualization. clickzone focuses on data quality, segmentation and action-oriented analytics.
Focus
Reporting
Dashboard
KPI
Segment
Cohort
Sources
GA4+
Why Data Analytics?
Reporting & Visualization Layer
KPI Dashboards
Looker Studio panels aligned to business goals.
Segmentation
Clear insights from behavior and cohort segments.
Data Quality
Consistent metric definitions and validation.
Action-Oriented
Outputs that connect reports to strategy.
Data Analytics
What Advantages Does It Provide?
Unify scattered data in one panel so teams share the same metrics. Speed up decisions based on clear KPIs—not gut feel.
See where drop-offs happen with segment, funnel and trend views; ground budget and product decisions in data.
Looker Studio comes first; Power BI or Tableau is supported when already in the client stack.
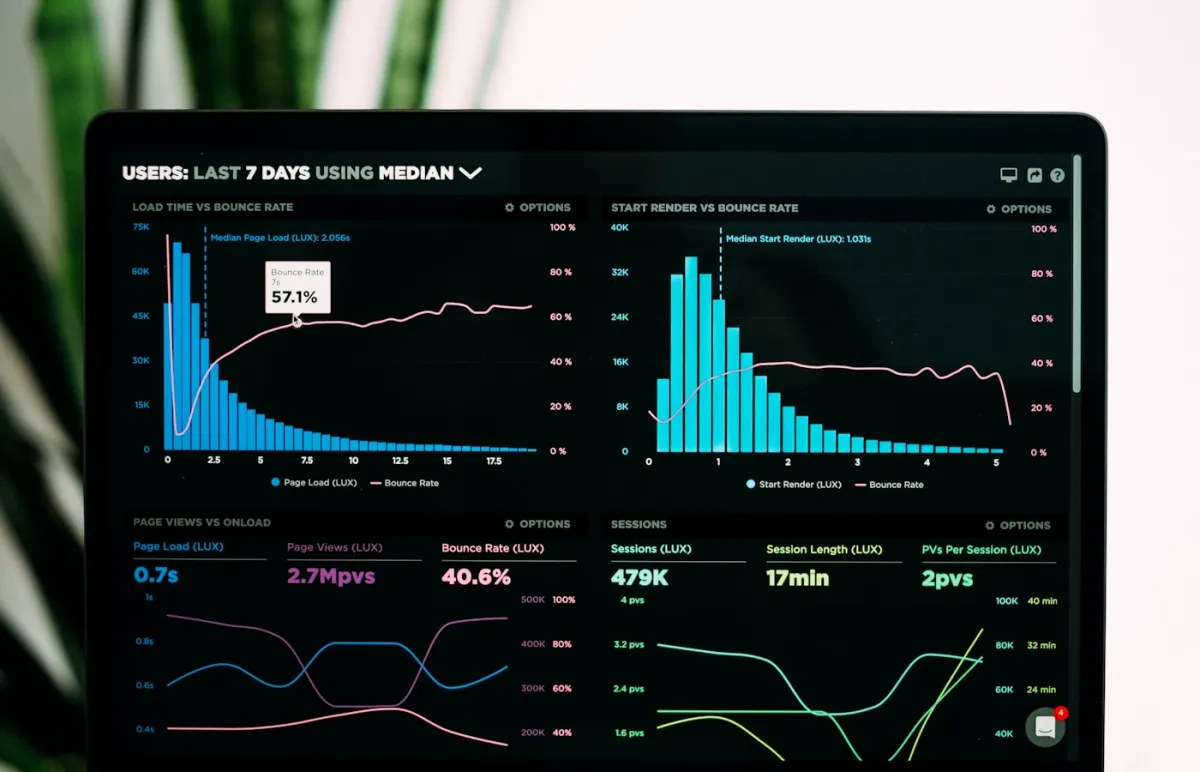
Data Analytics
Why Does It Matter?
Even with measurement in place, weak reporting slows decisions. Data Analytics makes performance manageable through dashboards, segmentation and data quality.
Key Points
Single-source KPI visibility
Deeper analysis via segments and cohorts
Looker Studio–first visualization that fits your stack
What Does clickzone Do?
A clear, measurable path from discovery to dashboard.
Data Discovery
Map sources, metrics and quality gaps.
Metric & Segment Design
KPI sets, segment definitions and reporting layer.
Dashboard Setup
Interactive Looker Studio panels (preferred).
Validation
Metric consistency and source checks.
Enablement
Short training so teams can read and act.
Continuous Improvement
Dashboard updates and data-quality follow-up.
What Sets Us Apart
We Tie Reporting to Business Decisions
Expert Team
Reporting in a shared language with analytics and growth.
Custom Dashboards
Panels built around your KPIs—not generic templates.
Source Integration
Bring GA4, ads and CRM sources together.
Data Quality
Definition consistency and measurement validation.
Segmentation
Action from behavior and value segments.
Transparent Reporting
Clear metrics with plain-language interpretation.
What’s Included in Data Analytics?
Reporting and visualization scope—see Digital Analytics for measurement infrastructure.
Custom Dashboard Design
KPI panels and interactive reports in Looker Studio.
Source Unification
Bring GA4 and other sources into one view.
Data Visualization
Looker Studio first; Power BI/Tableau when already in stack.
Segmentation & Cohort
Behavior segments and cohort analysis.
Live / Periodic Reports
Realtime reporting when you need live views.
Competitive Context
Market and competitor context via competitive analysis.
FAQ About Data Analytics
How is Data Analytics different from Digital Analytics?
expand_more
Which data sources do you support?
expand_more
How long does dashboard and reporting setup take?
expand_more
Do you use Looker Studio, Power BI or Tableau?
expand_more
How is dashboard access provided?
expand_more
How are metric definitions standardized?
expand_more
Is segmentation included?
expand_more
How often are reports refreshed?
expand_more
How does our team learn to use the panels?
expand_more
Is our existing GA4 setup enough?
expand_more
Don’t Leave Your Data to Chance
Get measurable reporting, clear dashboards and action-oriented analytics with clickzone.
Call Us
0850-304-11-91hello@clickzone.io
Don’t Leave Your Data to Chance
Get measurable reporting, clear dashboards and action-oriented analytics with clickzone.
Get in Toucharrow_forward